Debug
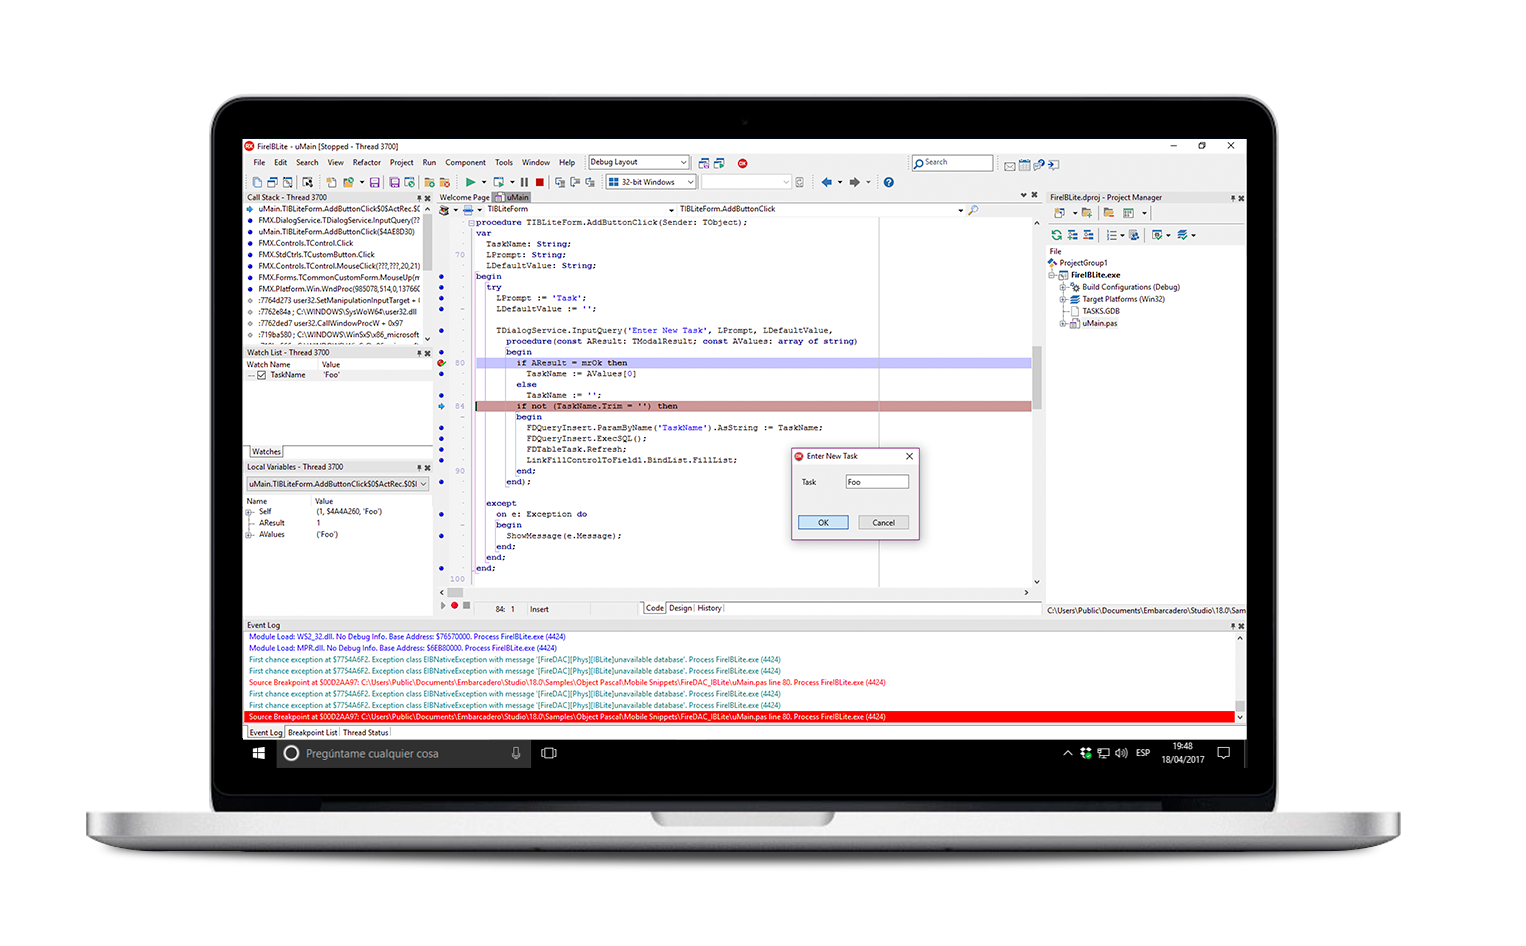
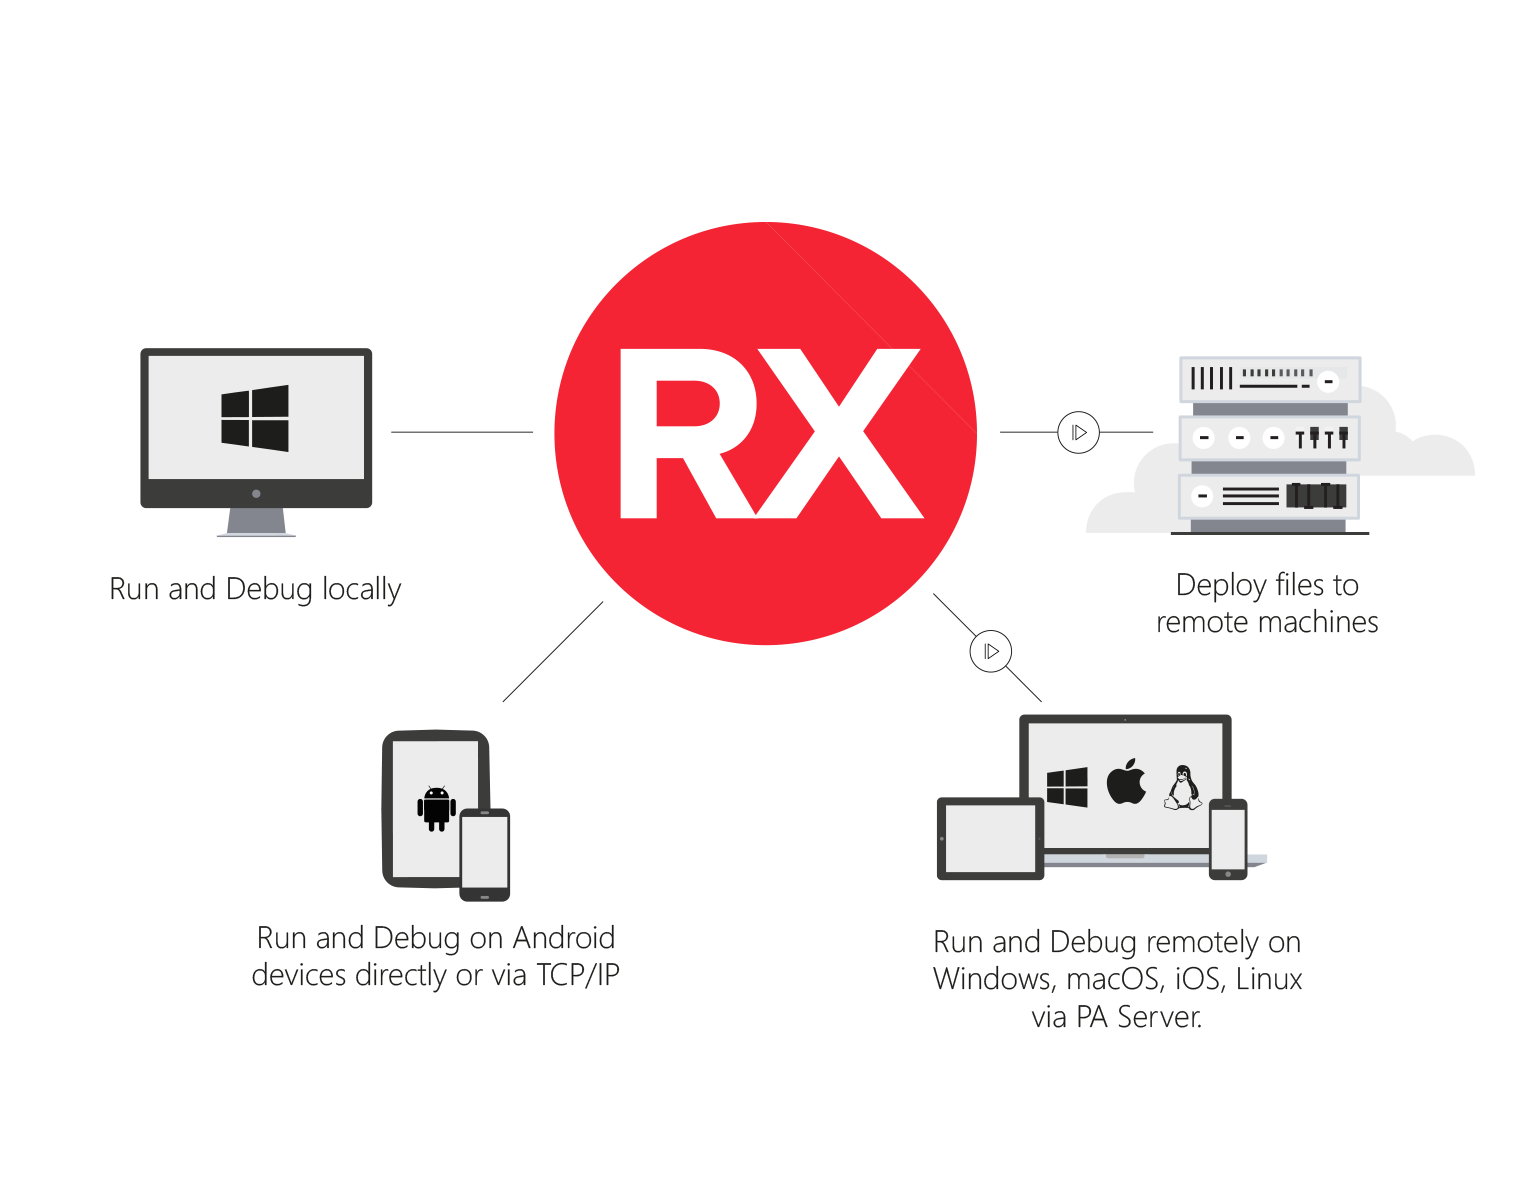
Get to the bottom of bugs faster with Integrated cross platform native debugging. Using the RAD Studio IDE you can debug applications running remotely on Windows, macOS, iOS and Android!
Conditional Breakpoints
Quickly pause program execution at a specified location or when a particular condition occurs as you test and debug your application using breakpoints. Setting source breakpoints and module load breakpoints in the Code Editor before and during a debugging session enables developers to quickly identify how the code is executing at runtime and the values being processed.


Explore the entire call stack
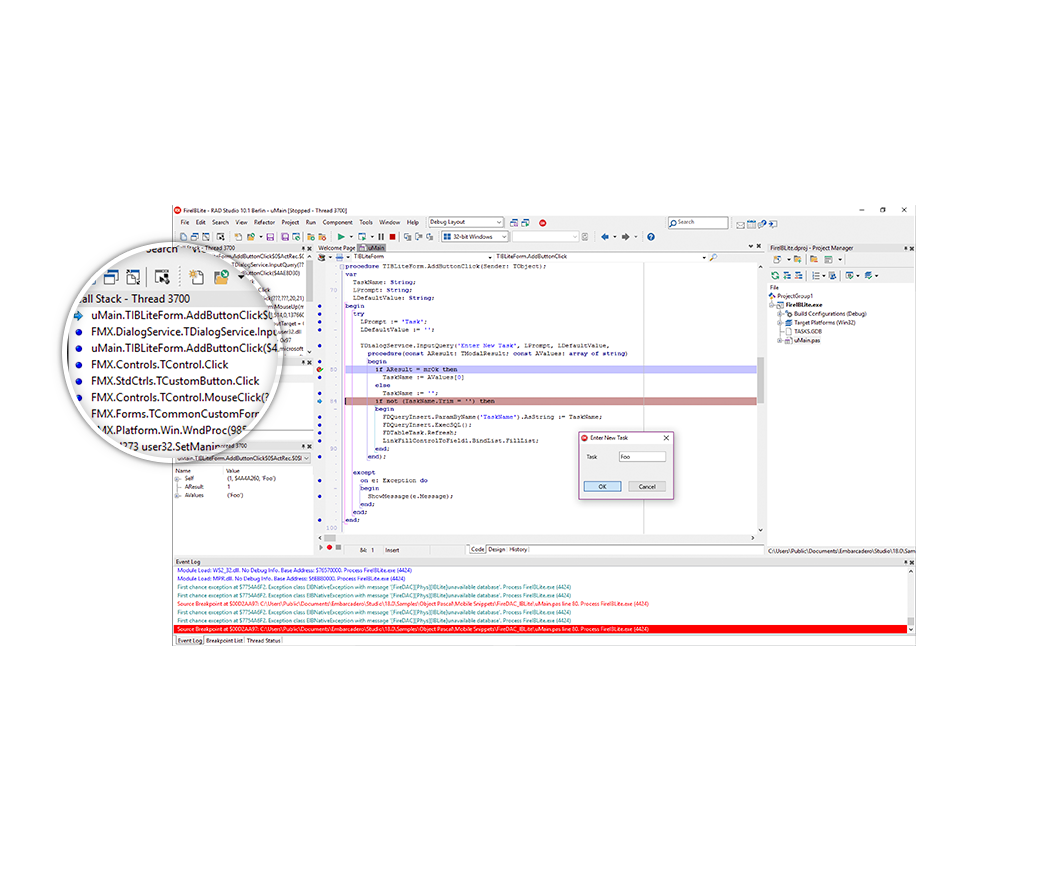
When using breakpoints, the call stack enables developers to trace backward to discover the route the executing code took to reach the current location, allowing questions such as “how did it get here” to be answered.
If your application is multi-threaded, view the call stacks for each thread.
What is the value?
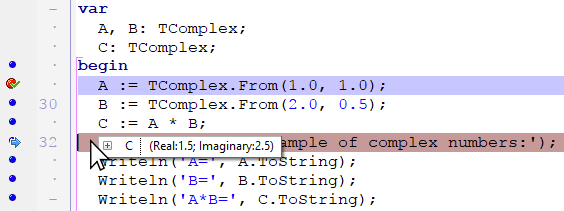
Easily display the current value of a variable while your program has paused during debugging. Point the mouse cursor to any variable name shown in the Code Editor to display ToolTip Insight


Cross Platform Live Debugging
在任何设备上进行调试!将您的应用程序部署到任何 iOS、Android 或 macOS 设备,并像在本地一样进行运行调试。在本地和远程设备上使用断点、堆栈挖掘、工具提示和表达式评估,并在所有部署平台上进行实时调试。
Locate any issues, recompile and deploy directly from the RAD Studio IDE ready to debug the updated application again.
